Next: Faults in geological maps Up: Mapping of faults and Previous: Orientation of planes with Contents
Stereonetes are very useful for plotting the orientation of many faults in a single 2D plot ![[*]](crossref.png) .
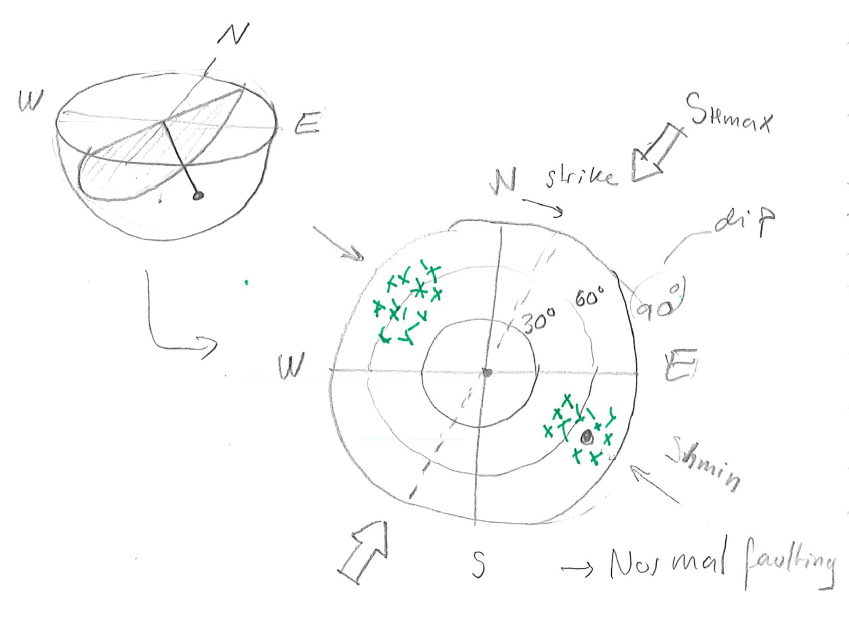
The stereonet represents a fault plane by a dot which is the intersection of a line normal to the fault plane and a lower hemisphere projection.
.
The stereonet represents a fault plane by a dot which is the intersection of a line normal to the fault plane and a lower hemisphere projection.
 |
