Next: Orientation of planes with Up: Stresses on Faults and Previous: Introduction Contents
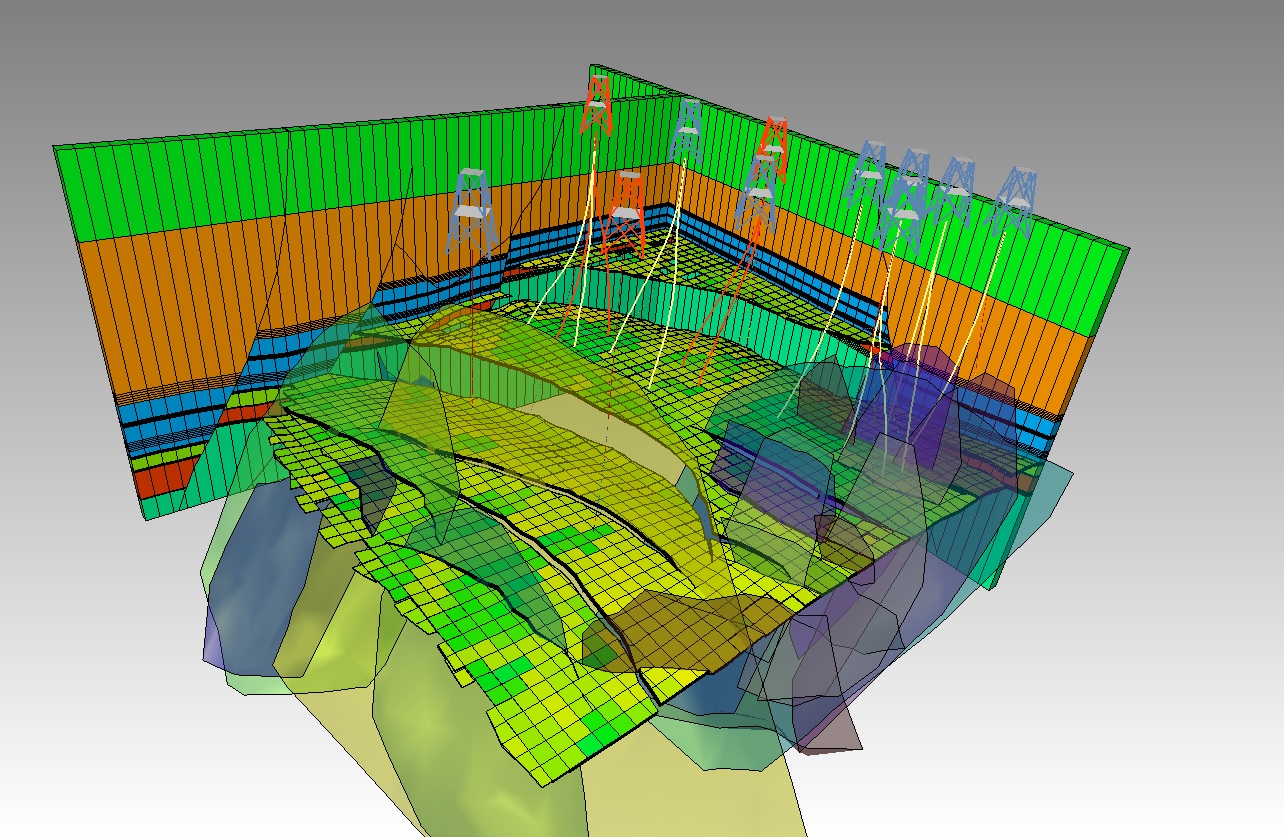
Faults in subsurface formations are usually mapped through seismic reconstruction (see example in Fig. ![[*]](crossref.png) ) and wellbore imaging.
Fig. 5.3-a shows the typical signature of fractures in a wellbore.
An anomaly of electrical resistivity or ultrasonic P-wave velocity facilitates recognizing the fracture (dark pixels in the image).
The reconstruction of this image (Fig. 5.3-b) helps measure fracture orientation (strike and dip - Fig. 5.3-c).
) and wellbore imaging.
Fig. 5.3-a shows the typical signature of fractures in a wellbore.
An anomaly of electrical resistivity or ultrasonic P-wave velocity facilitates recognizing the fracture (dark pixels in the image).
The reconstruction of this image (Fig. 5.3-b) helps measure fracture orientation (strike and dip - Fig. 5.3-c).
Comprehensive fracture mapping helps create 3D reservoir models that account for falut and fracture geomechanics (5.4). The magnitude of shear and normal stresses on faults and fractures depends on their orientation respect to the in-situ stress tensor.
![\includegraphics[scale=0.60]{.././Figures/split/6-8.pdf}](img504.svg)