
8. Reservoir depletion and injection#
8.1 Changes of stress in the reservoir rock#
Reservoir depletion requires changes of pore pressure. A decrease of pore pressure \((P_f - P_o)\) results in increased effective stress in the depressurized region. Effective stresses increase because the overburden \(S_v\) remains constant above the reservoir but the pore pressure decreases. The result is compaction of the reservoir (Fig. 229). Such deformation also affects neighboring formations and faults. Changes in ground surface elevation are refered as “subsidence”. Differential displacements (for example across a fault) can result in casing damage and shearing. Significant compaction in the reservoir layer can result in casing buckling. The reduction of pore pressure also causes a reduction of total horizontal stress within the reservoir.
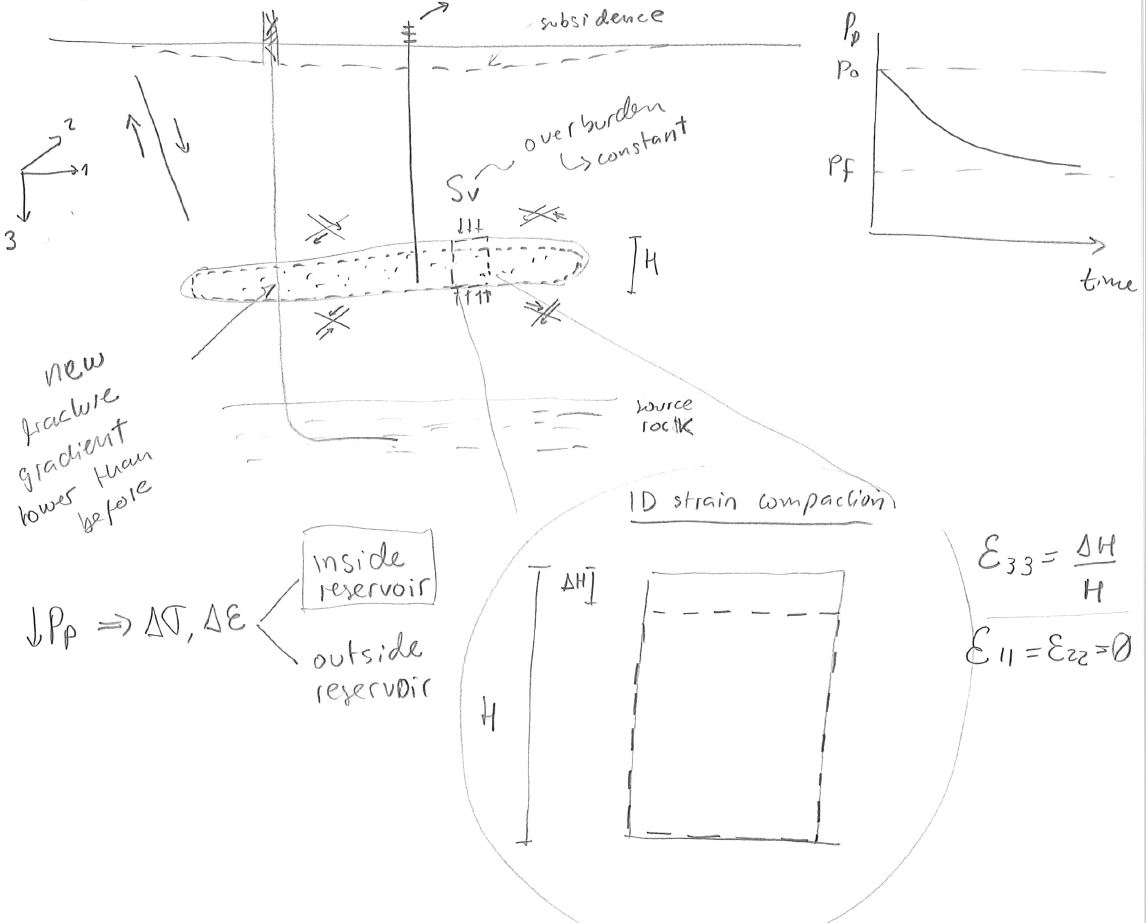
Fig. 229 Schematic of deformation induced by reservoir depletion.#
Rock compressibility and permeability#
Reservoir depletion in horizontal, laterally extensive and thin reservoirs approximates to a one-dimensional-strain stress path, i.e. there is change in strain only in the vertical direction (Fig. 229). Such stress path results in increased effective stresses in both vertical and horizontal directions.
Increased effective stresses result in reduction of porosity and permeability in most cases. The permeability of fractured rocks tends to be more sensitive to stress than typical rock matrices. The reason is that permeability is proportional to the \(d_{pore}^2\) in rock matrix, while permeability is proportional to the \(w_{f}^3\) in fractures (Fig. 230). The variability of rock permeability with stress is called “fracture compressibility”. The decline curves of unconventional formations are highly influenced by fracture compressibility.
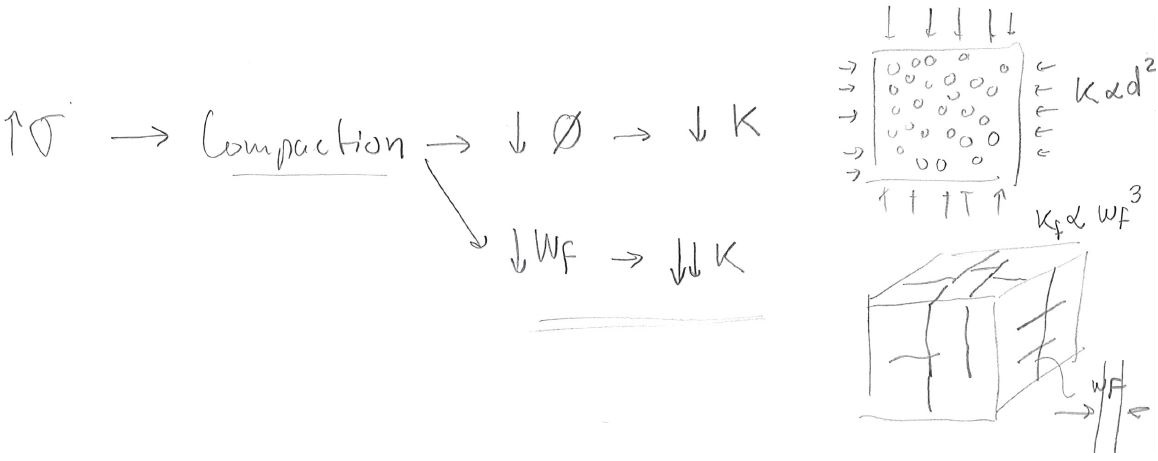
Fig. 230 Impact of increased effective stress on porosity and permeability.#
Linear poroelasticity solution#
Let us use the theory of poroelasticity (Section \ref{sec:poroelasticity}) to solve for the changes of total and effective stresses with depletion. According to this theory, effective stress must be corrected for the Biot coefficient \(\alpha\) so that,
We use this equation of effective stress together with linear isotropic elasticity in order to relate stresses to strain (\( \underset{=}{\sigma} = \underset{=}{C} \: \underset{=}{\varepsilon}\), and the assumption of one-dimensional strain \(\underset{=}{\varepsilon} = [0,0,\varepsilon_{33},0,0,0]^T\) (3-vertical direction):
The equation corresponding to the 3rd row results in:
The denominator is the constrained modulus \(M = E(1-\nu)/[(1+\nu)(1-2\nu)]\). Hence, the vertical strain in the reservoir layer is:
Remember that \(S_{33}\) is the overburden stress and does not change with time or with reservoir pore pressure. Notice that depletion (\(\Delta P_p<0\)) results in compaction (\(\Delta \varepsilon_{33}>0\)). This deformation is linked to the reservoir compressibility. Hence, according to linear poroelasticity the uniaxial bulk compressibility is \(C_{bp} = \alpha / M\) (See Section \ref{sec:ResCompress}).
Combining Equations from rows 1 and 3 (or 2 and 3), results in
Depletion (\(\Delta P_p<0\)) results in decreases of horizontal stress (\(\Delta S_{11}<0\)). The same change of stress occurs in direction 2. The coefficient of proportionality in the previous equation is usually referred as \(A = \alpha \frac{1-2\nu}{1-\nu}\) and varies typically from 0.5 to 0.9. The prediction of \(S_{11}\) can be validated through hydraulic fracture tests that measure minimum horizontal total stress \(S_{hmin}\) in places with normal faulting and strike slip regime.
A total stress path plot describes the value of total stresses as a function of pore pressure (Fig. 231).

Fig. 231 Total stress path plot. (a) Conceptual plot. (b) Example from the North Sea. The points corresponds to measurements from hydraulic fracture tests.#
Depletion results in increased effective stresses. The change of (Biot) vertical effective stress \(\sigma_{33} = S_{33} - \alpha P_p\) (with \(S_{33}\) constant) is
From Eq. (52), the change of (Biot) horizontal effective stress with pressure is
Both, horizontal and vertical effective stresses increase with depletion. This results in a shift of the Mohr circle to the right and up, i.e. increased mean effective stress and increased deviatoric stress (Fig. 232). Large compressive and shear stresses can result in rock failure under compression and shear. Grain crushing can significantly decrease the rock permeability. Combined compression and shear failure lead to shear compaction bands.
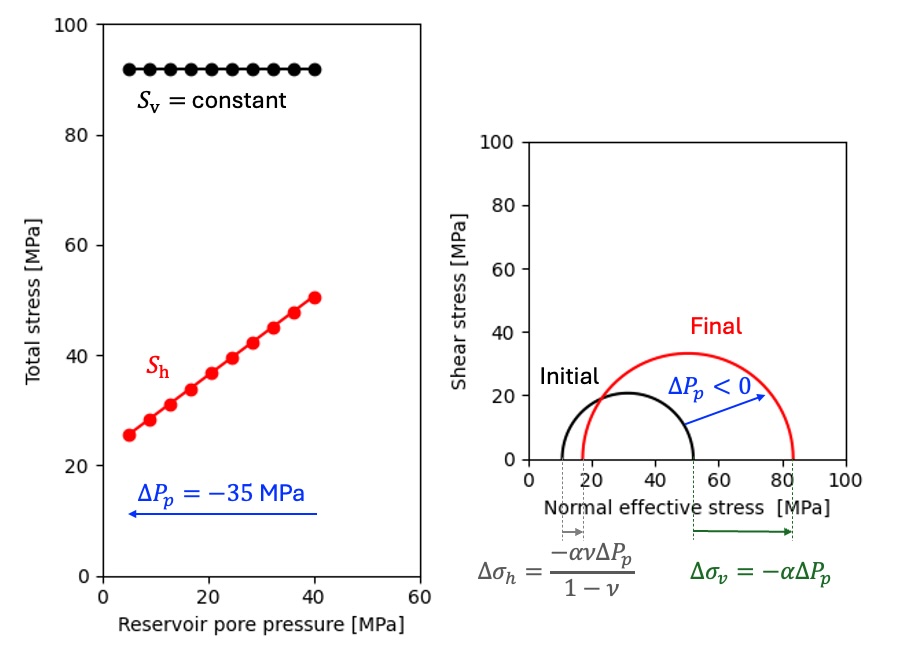
Fig. 232 Change of effective stress with depletion. Both horizontal and vertical effective stresses increase within the depleted reservoir. Note: here we plot Biot effective stresses.#
Example 8.1
Calculate the following due to depletion of 35 MPa.
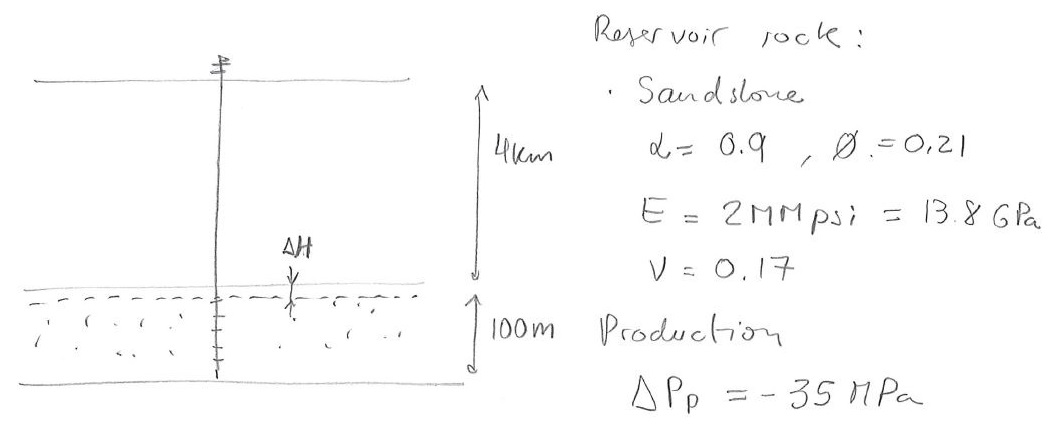
Fig. 233 Example 8.1.#
Displacement \(\Delta H\) at the top of the reservoir.
Pore compressibility \(C_{pp}\).
Change of total horizontal stress \(\Delta S_{h}\).
Changes of effective vertical \(\Delta \sigma_{v}\) and horizontal stresses \(\Delta \sigma_{h}\).
Change of permeability \(k/k_o\) with the following law (\(c_f = 0.25\) MPa\(^{-1}\) ): \( k = k_o \: \exp \left[ -c_f (\sigma_h - \sigma_h^o) \right] \)
SOLUTION
The constrained modulus is
\( M = \frac{E(1-\nu)}{(1+\nu)(1-2\nu)} = 14.8 \text{ GPa} \)
Then, the displacement at the top of the reservoir is \(\Delta H = \Delta \varepsilon_{33} H\), where
\( \varepsilon_{33} = -\frac{\alpha}{M} \Delta P_p = 0.21 \% \)
Hence, \(\Delta H = 0.21\% \: 100 \text{m } = 0.21\) m.
The bulk compressibility is
\( C_{bp} = \frac{\alpha}{M} = 0.06 \times 10^{-9} \frac{1}{\text{Pa }} = 0.42 \times 10^{-6} \frac{1}{\text{psi }} \)
Thus, the pore compressibility is
\( C_{pp} = \frac{C_{bp}}{\phi} = 2.0 \times 10^{-6} \frac{1}{\text{psi }} = 2.0 \: \mu \text{sip} \)
The change of total horizontal stress is \( \Delta S_{h} = \alpha \frac{1-2\nu}{1-\nu} \: \Delta P_p = 0.716 \times (-35 \text{ MPa }) \sim -25 \text{ MPa } \)
The changes of effective stresses are \( \Delta \sigma_{33} = - \alpha \Delta P_p = - 0.9 \times (-35 \text{ MPa }) = + 31.5 \text{ MPa } \)
\( \Delta \sigma_{11} = - \alpha \frac{\nu}{1-\nu} \Delta P_p = + 6.45 \text{ MPa } \)
Last, the ratio between final and initial permeability \(k/k_o\) is \( \frac{k}{k_o} = \exp \left[ -c_f (\sigma_h - \sigma_h^o) \right] = \exp \left[ -0.25 \text{ MPa}^{-1} (+6.45 \text{ MPa}) \right] \sim 0.2 \: \: \blacksquare \)
8.2 Changes of stress and displacements outside the reservoir#
Changes of pore pressure and temperature in a reservoir alter the state of stress around the reservoir, similar to what happens around a wellbore after it is drilled. Fig. 229 shows that depletion is analogous to a reduction of volume in a confined reservoir, such that total horizontal stress increases above and below the reservoir. Faults and fractures may reactivate in reverse faulting if effective stress surpass the shear failure limit.
Furthermore, the decrease of volume experienced by the reservoir (mostly vertical) propagates upwards and may result in ground displacements. A simple model with a plane-strain solution of depletion of rectangular reservoir predicts surface displacements are proportional to:
reservoir thickness, \(T\)
reservoir half length, \(a\)
reservoir proximity to the surface, quantified by reservoir depth \(D\) (Fig. 234).
The predicted displacements and horizontal strain are (Segall, 1989):
where
\(\nu_u\): undrained Poisson ratio
\(B\): Skempton parameter
\(\Delta m(t)= \frac{(1-2\nu) \alpha \rho_o}{2\mu (1+\nu)} \left[ \sigma_{kk} + \frac{3}{B}p \right]\): change of fluid mass content per unit of volume
\(\rho_o\): fluid initial mass density
\(\xi_- = (y-a)/D\)
\(\xi_+ = (y+a)/D\)
\(x\) is the vertical direction and \(y\) is the horizontal direction
Fig. 234 shows an example of surface displacement predicted by the equations above. Depletion and net fluid loss lead to surface subsidence, while injection and net fluid gain lead to heave. The vertical displacement is maximum above the reservoir center and extends beyond the reservoir horizontal limits.

Fig. 234 Surface displacements caused by depletion/injection predicted by a cartesian plane-strain model. (Top) Model geometry including \(D\) = 1000 m, \(a\)= 500 m, \(T\) = 100 m. (Middle) Normalized solution for \(\Delta m_t = \) 5 kg/m\(^3\) (depletion). (Top) Surface displacement solution for \(\Delta m_t = \) 5 kg/m\(^3\) (depletion). The surface moves down about 12 cm above the reservoir. The surface moves laterally towards the center line of the reservoir (\(y=0\) m).#
Fig. 235 shows examples of subsidence and heave for real examples. Notice that ground displacements tend to be concentric around the depletion or injection points.
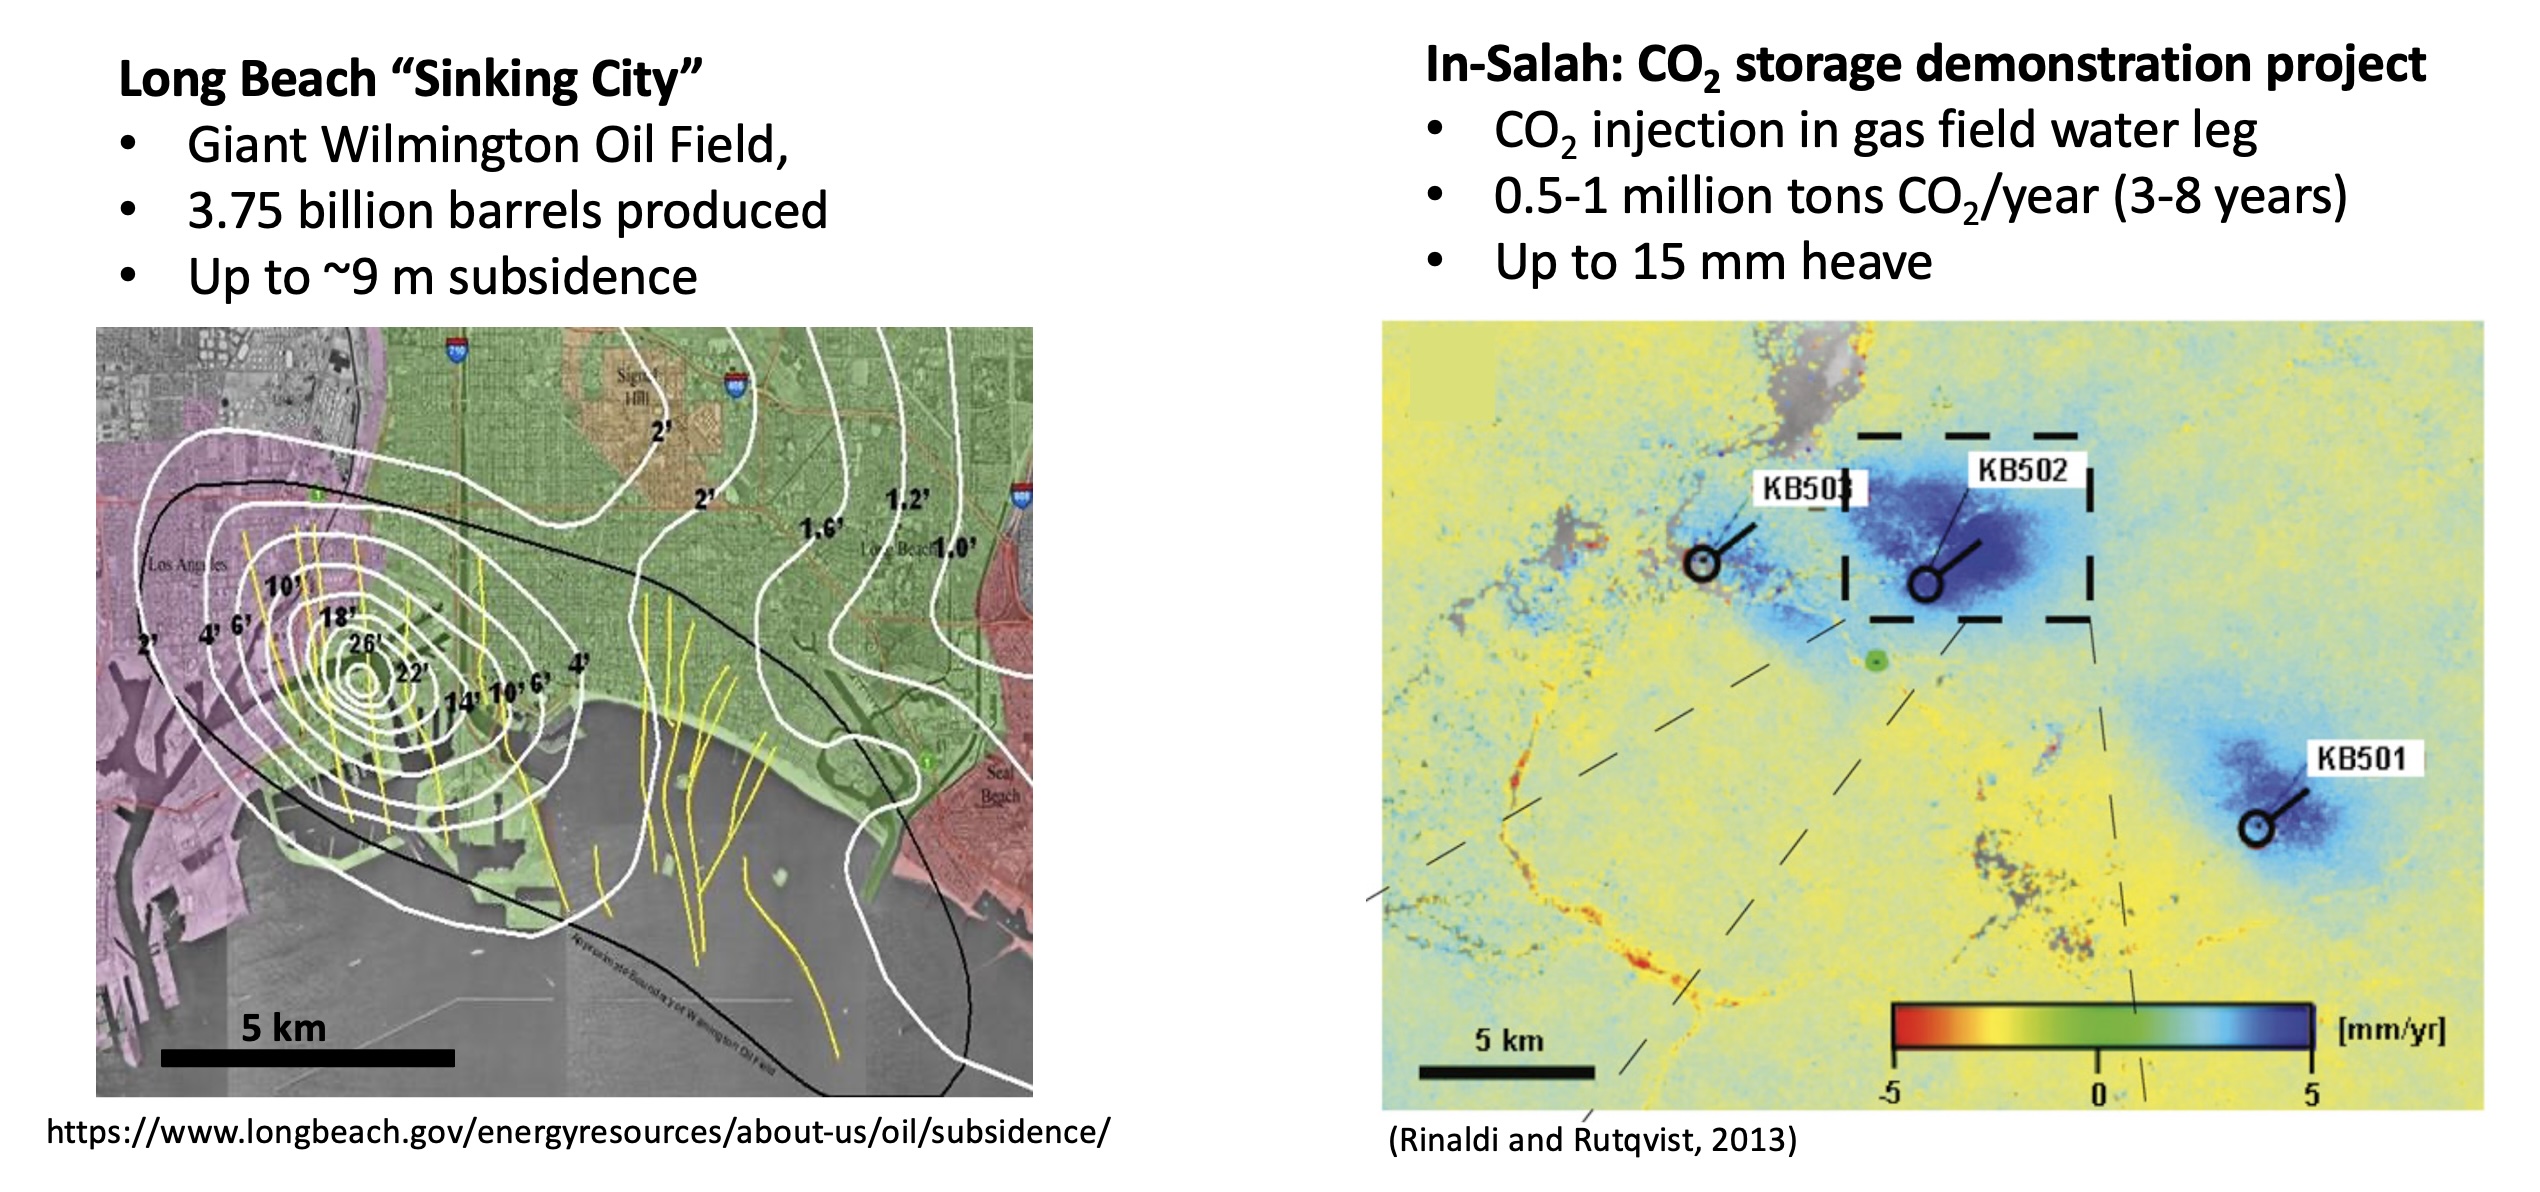
Fig. 235 Surface displacements caused by oil depletion (left) and CO\(_2\) injection (right).#
8.3 Fluid injection#
Fluid injection would result in opposite effects of fluid depletion including:
Pore pressure increases in the reservoir.
Total horizontal stress increases in the reservoir.
Vertical and effective stresses decrease in the reservoir.
Total horizontal stress decreases in the caprock.
The reservoir “swells” and the ground surface above the reservoir moves up.
All of these are valid under isothermal fluid injection conditions. However, subsurface fluid injection usually is non-isothermal, with fluid temperature lower than the reservoir temperature. A large decrease of temperature in the reservoir can change the trends listed above.
Finally, while depletion lowers the “total energy” of the reservoir-caprock-surrounding rock system, injection increases its energy. Reservoir pressurization will have a maximum allowable pressure at which either fault reactivation or hydraulic fracturing might happen releasing fluid-pressure energy. These allowable maximum pressures must be carefully investigated to avoid geomechanical issues such as induced seismicity and loss of mechanical seal integrity.
8.4 Fault stability#
TBD
8.5 Coding support for solving problems#
You may use the python code available in the following link at Google Colab: Ch. 8 on Reservoir Depletion and Injection. I suggest you use it as “inspiration” and learning, but write your own. Make sure to acknowledge any copying and pasting.
8.5 Suggested Reading#
Fjaer, E., Holt, R.M., Raaen, A.M., Risnes, R. and Horsrud, P., 2008. Petroleum related rock mechanics (Vol. 53). Elsevier. (Chapter 12)
Zoback, M.D., 2010. Reservoir geomechanics. Cambridge University Press. (Chapter 12)
Segall, P. “Earthquakes triggered by fluid extraction”. Geology 1989. doi: 10.1130/0091-7613(1989)017
Sinking City (web article)