Next: 5.5 Critical state soil Up: 5. Inelasticity Previous: 5.3 Plastic strains Contents
The following data set has experimental data of shear strength for the Darley Dale Sandstone measured in an axisymmetric triaxial cell.
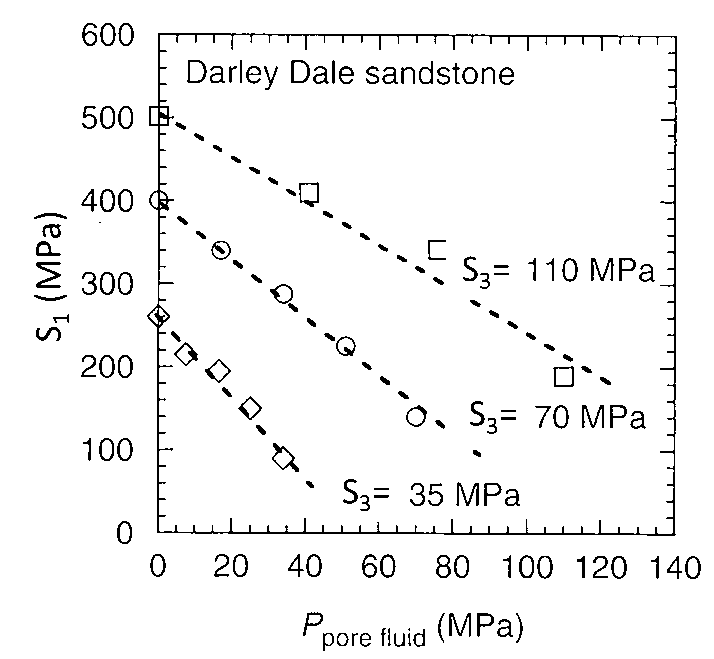 |
where  is the maximum total principal stress,
  is the minimum total principal stress, and
 is the pore pressure in the rock.
 .
.
 and friction angle
  from point (1) and draw the shear failure line together with Mohr circles at failure.
 v.s.
v.s.
 space.
For this assignment you have to be able to calculate principal stresses on the wall of a wellbore at an arbitrary deviation and azimuth (See Chapter 6 of my notes “Wellbore stability” (https://dnicolasespinoza.github.io/) and Zoback's book Ch. 8).
Develop a script to compute and illustrate graphically (lower hemisphere projection):
 and a simple tensile strength criterion (independent of intermediate and maximum principal stresses), i.e., required
  .
and a simple unconfined compression strength criterion, i.e., required
.
and a simple unconfined compression strength criterion, i.e., required  .
.
 considering a Mohr-Coulomb shear failure criterion and the properties of the Darley Dale Sandstone from Exercise 1.
considering a linear v.s.
shear failure criterion and the properties of the Darley Dale Sandstone from Exercise 1.
considering a Modified Lade shear failure criterion (Zoback's book, p. 100) and the properties of the Darley Dale Sandstone from point 1.
considering a Mohr-Coulomb shear failure criterion and the properties of the Darley Dale Sandstone from Exercise 1.
considering a linear v.s.
shear failure criterion and the properties of the Darley Dale Sandstone from Exercise 1.
considering a Modified Lade shear failure criterion (Zoback's book, p. 100) and the properties of the Darley Dale Sandstone from point 1.
Limit your wellbore breakout angle plots to
 because predictions with linear elasticity over
 are likely highly inaccurate.
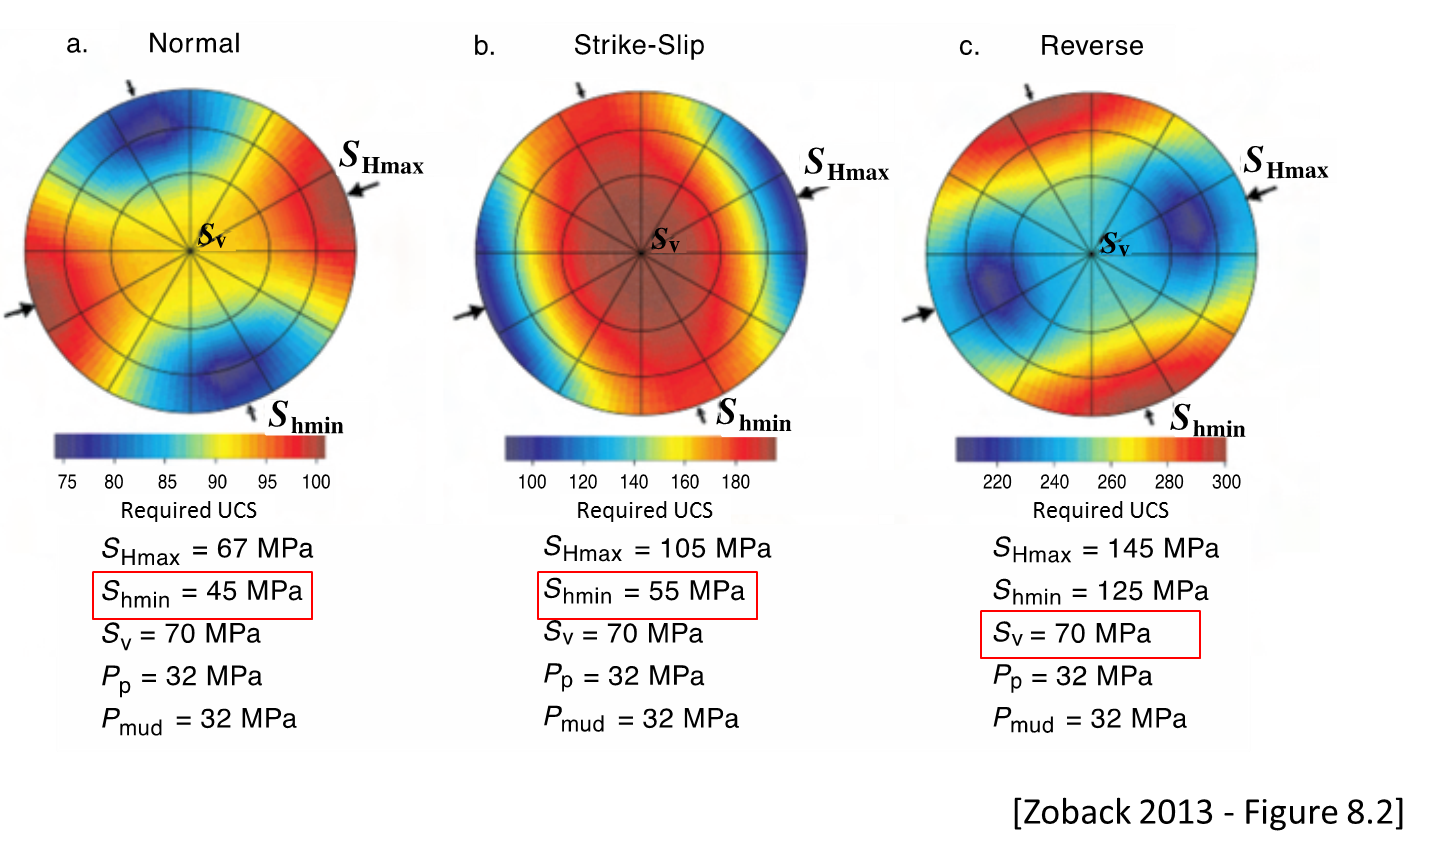
Test your script with the three examples given in Zobacks's book in Figures 8.2 and 10.4 (normal faulting, strike-slip faulting, and reverse faulting). When computing breakouts assume
are likely highly inaccurate.
Test your script with the three examples given in Zobacks's book in Figures 8.2 and 10.4 (normal faulting, strike-slip faulting, and reverse faulting). When computing breakouts assume  = 32 MPa (NF), = 40 MPa (SSF), and = 52 MPa (RF). Use a Poisson ratio of 0.25 for stress calculations.
 |
